The Average Directional Index (ADX) is another of the indicators invented by Welles Wilder in 1978. The ADX can be very complicated to use if you are visually very used to a line moving upwards meaning that it is the price that is moving. upwards. In fact, the ADX measures the strength of the trend without worrying about its direction, so the ADX line may be moving up when a downtrend is gaining strength.
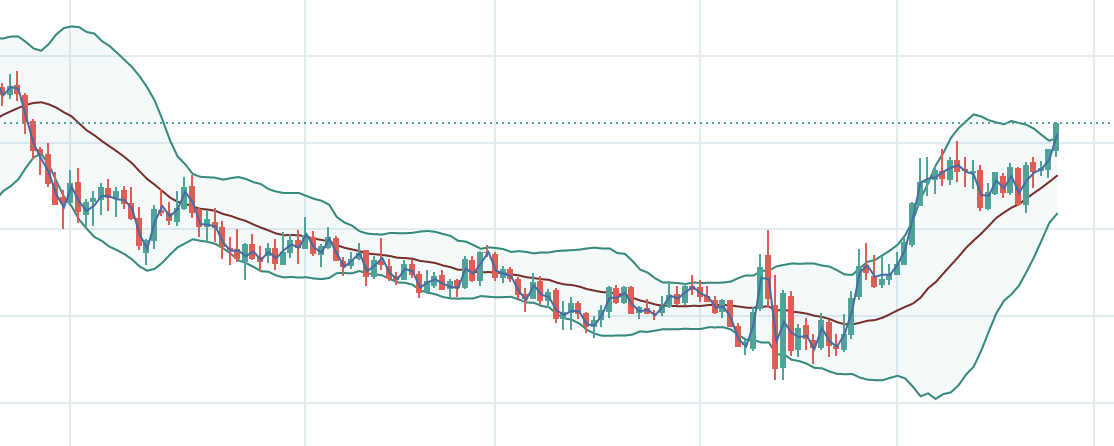
ADX is commonly referred to as a leading indicator, because dynamics shoots ahead of price, rising or falling and then reversing the trend. This was Wilder’s idea and, broadly speaking, that statement is true, but remember that all dynamics indicators work best when a trend is in progress and often give false signals within the trading range. In fact, one of the primary applications of ADX is to differentiate between trends and trading range.
The ADX is almost always used in conjunction with other indicators that show direction, the Directional Minus Indicator (-DI) and the Directional Plus Indicator (+ DI). This way you will be able to know both the strength and the direction of the trend.
The ADX is displayed as a simple line with values ranging from the low of zero to 100. The level of 25 is a dividing line between “weak and no trend” and “trending”. A trend is strong between 25 and 50, and very strong between 50 and 75. From 75 to 100 the trend is so strong that you should start to check if the price is oversold or overbought.
Using the ADX is not difficult, but calculating it is highly complicated. Like most Wilder indicators, it focuses on the relative highs and lows within the most recent range, not the open / close ratio. You must first calculate the directional motion, DM, for its acronym in English. When prices are trending upward, the DM adds a plus sign: + DM. This is why it is called positive DM, Plus DM, or upward movement. If the direction is bearish, the DM adds a minus symbol: –DM. That is why it is called negative DM, Menis DM, or downward movement.
The + DM occurs when today’s highs minus yesterday’s highs gives a positive result (upward movement) and is greater than yesterday’s low minus today’s low (downward movement) and greater than zero.
The -DM occurs when downward movement is> than upward movement and> zero.
The calculator + DI is calculated as follows:
+DI = 100 x (EMA x (+DM)) / ATR
And the -DI is calculated similarly:
-DI = 100 x (EMA x (-DM)) / ATR
Note that if the + DM is negative you must use zero as its value and that, if the –DM indicator is positive, you must also use zero. Wilder used a 14 day period for the MD and ATR, but you are welcome to use any other time frame or to change the EMA (exponential moving average).
In the end, the formula is:
ADX = 100 x EMA ((+DI – -DI)/(+DI + -DI))
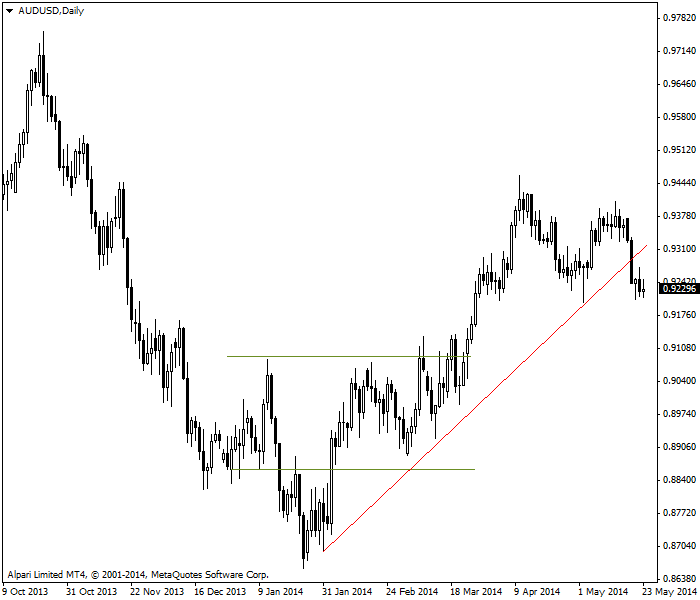
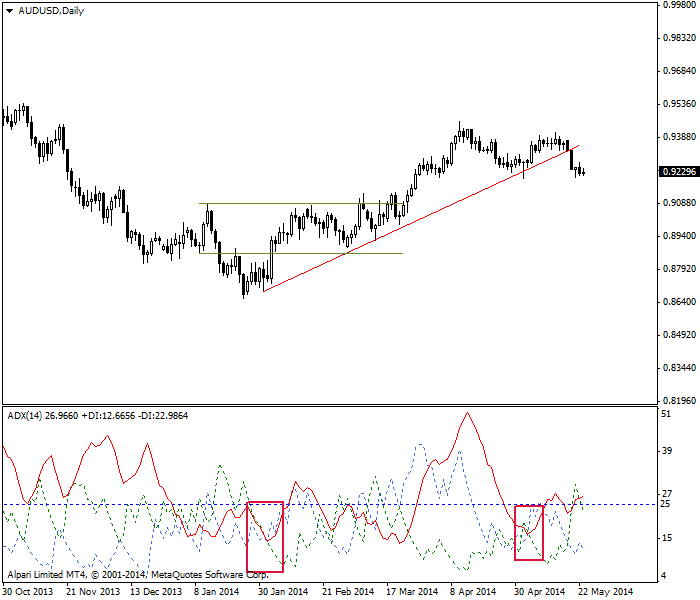
Wilder invented the ADX (and all its indicators) before the PC came along. Fortunately for us, every program today has a canned version of ADX and its components, -DI and + DI. However, it can be difficult to understand the calculation method as there is a lot of rounding in the ADX. The components of the DM are rounded only with the removal of inner days and the ADX is rounded by dividing by the ATR. It has the virtue of offering a very reliable indicator, but it can also be out of date or difficult to interpret. In the following example graph we see an upward movement in the price that begins six whole periods before the ADX line exceeds the value of 25, the criterion that marks a trend in which it is worth investing.
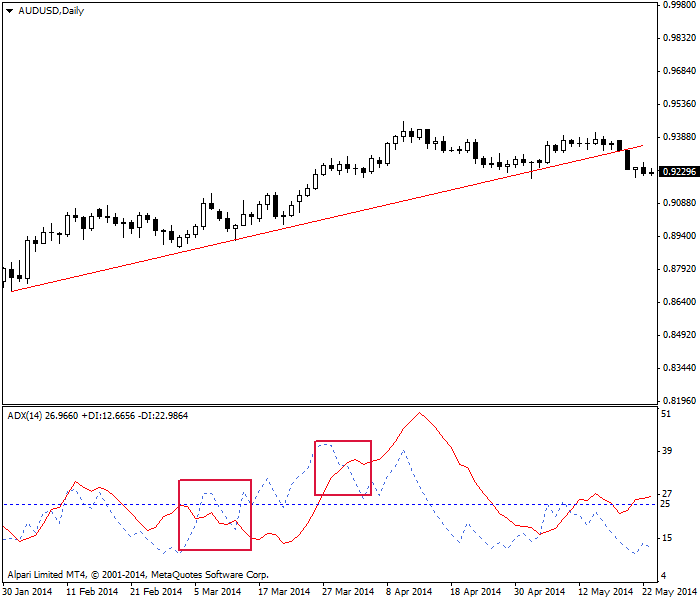
The graph below shows a larger image of the same situation. We were able to draw a red and growing line of support, which can blind us to the unhappy lateral movement that the golden lines mark. With we expect a break above the previous highs until the end of the golden lines. Our eyes may miss it, but the ADX identified it correctly. If you are deeply against taking risks, ADX can become your new best friend.
Now take a look at the graph with all the ADX components – the DI is green. Note that as the price in the upper window begins to rise, the -DI falls below the + DI and stays there longer as the uptrend develops. As with all crossover systems, the + DI going up and above the –DI is a buy signal. On the far right, when the support line breaks. The –DI rises above the + DI. Again, don’t be fooled by a bullish indicator line. It is related to the increase in the strength of the bearish movement, not to the price. Here, the -DI crossing over the + DI is a sell signal. You may fall into the desire to believe that the breakout by the bearish movement is only temporary, but the ADX system is telling you not to be fooled, exit the position.
Unfortunately, you will suffer many strange crossings and it can be very easy to be irretrievably confused. Therefore, it is always a good idea to use other confirmatory indicators with the ADX, including MACD and pattern recognition.