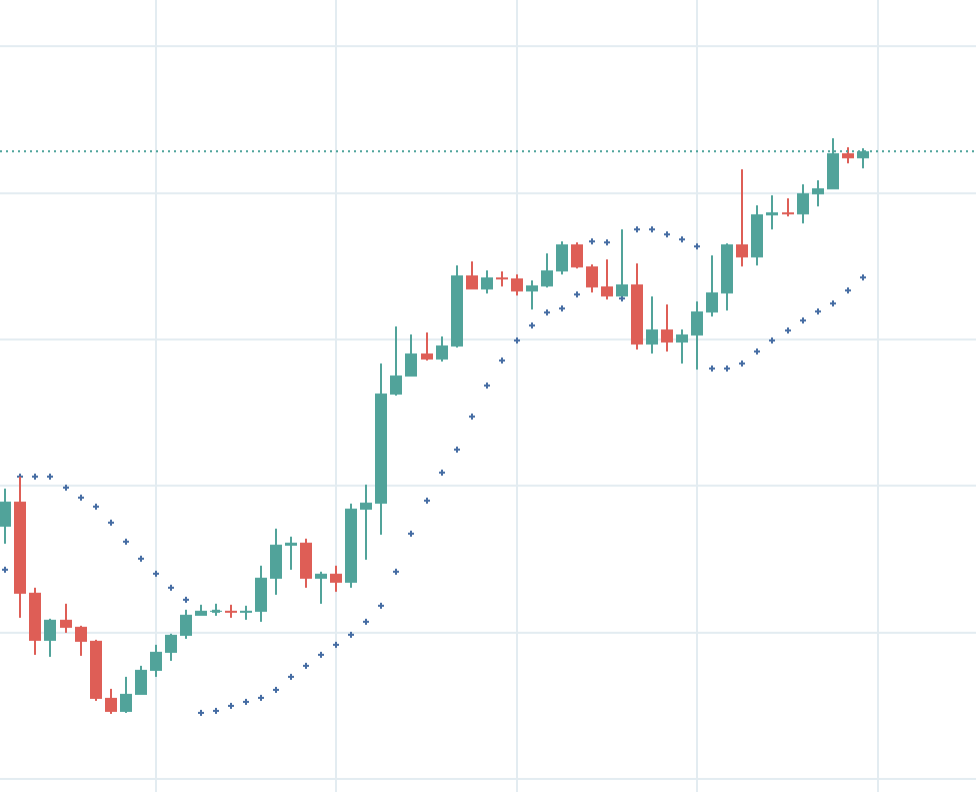
Determining when a market trend might be on the verge of a reversal becomes more accessible with the Parabolic SAR indicator. This tool strategically places points on the chart, signaling potential shifts in price movement. Observing the chart dynamics, you’ll notice these points transitioning from beneath Japanese candles during an uptrend to above the candles when the price veers into a downtrend.
What makes the Parabolic SAR particularly user-friendly is its simplicity. A quick glance at the chart reveals a straightforward approach: when the points are below the candles, it’s a buy signal, and when they’re above, it’s a sell signal.
This indicator is renowned for its ease of interpretation, assuming a binary perspective—either the price is ascending or descending. Consequently, it finds optimal utility in trending markets characterized by substantial upward or downward movements. However, caution is advised when deploying the Parabolic SAR in sideways markets, where prices move in both directions.
Understanding the Parabolic SAR Calculation
The Parabolic SAR calculates and plots SAR levels on the graph using the following formula:
SARNEW=SARCURRENT+AF×(EPCURRENT−SARCURRENT)
Breaking down the formula:
- AF (Acceleration Factor): This variable value increases incrementally for each period in which a new high is reached (for long positions) or new low (for short positions). Wilder initially suggested an AF value of 0.02, escalating in steps of 0.02 until it reaches a maximum of 0.20.
- EP (Extreme Point): This represents the maximum or minimum price attained during the current trend, with the maximum for an uptrend and the minimum for a downtrend.
The indicator curve serves as a guide to predict potential trend changes. Wilder’s concept suggests that a trending market is likely to adhere to the curve on the chart. Any deviation, breaking the curve, could signal the end of the trend—a cue to close and possibly reverse your position.
Optimal Parameters and Interpretation
Determining the best parameters for the Parabolic SAR hinges on factors such as risk tolerance, preferred time frame, and your overall trading strategy objectives. Experience will guide you to the parameters that align with the indicator’s strengths.
Key considerations:
- Lower acceleration factors result in a greater distance from the price, while higher factors bring the indicator closer to the price.
- The likelihood of reversal increases with a higher acceleration factor, but excessively high values may lead to frequent reversals, potentially reducing indicator accuracy.
Wilder, in his trading strategy, found the default AF value of 0.020 to be optimal. He suggested a range between 0.018 and 0.021 as suitable and advised against setting a value higher than 0.22.
Basic Strategy for Implementation
To apply the Parabolic SAR indicator effectively:
- Add the Parabolic SAR to a MetaTrader 4 trading chart.
- The dots indicate where to set your stop or stop value, following the market trend closely. As the trend persists, the increasing acceleration factor signals that the stop is nearing the price. If the market movement doesn’t favor your position, the indicator prompts you to halt and consider a change in direction.