The Alligator Indicator (Alligator Indicator) is a technical indicator developed by Bill Williams to study stock trends based on three moving averages.
The Alligator indicator is a trend indicator that is used to know if the stock trend is bullish or bearish. Likewise, being composed of three different moving averages, it gives us signals to enter the market.
His name “Alligator” means crocodile. Bill Williams called it that to perform the simile of the behavior of this animal. Each moving average, based on color, represents a part of the crocodile’s mouth.
How is the Alligator indicator calculated?
To find out why they are of different colors and of different periods with different displacement, let’s see how they are calculated. The formula for the Alligator indicator is:
- M = SMAs of 13 periods (PM) and 8 of displacement
- D = SMAs of 8 periods (PM) and 5 of displacement
- L = SMAs of 5 periods (PM) and 3 of displacement
To take into account the following considerations:
- J= Jaw
- T = Teeth
- L = Lips
- SMAs= Smoothed Moving Average
- PM = The moving averages are calculated on the midpoints of the Japanese candles. [(Maximum + Minimum) / 2]
- Displacement = It is the number of period that the moving average moves forward
Trading with the Alligator indicator
Bill William recommends using the Alligator indicator in conjunction with the Gator Oscillator. So to speak, the Gator serves as a confirmation to the Alligator indicator. Next we will see how to trade with this indicator. We can operate it in two ways:
Moving averages crosses
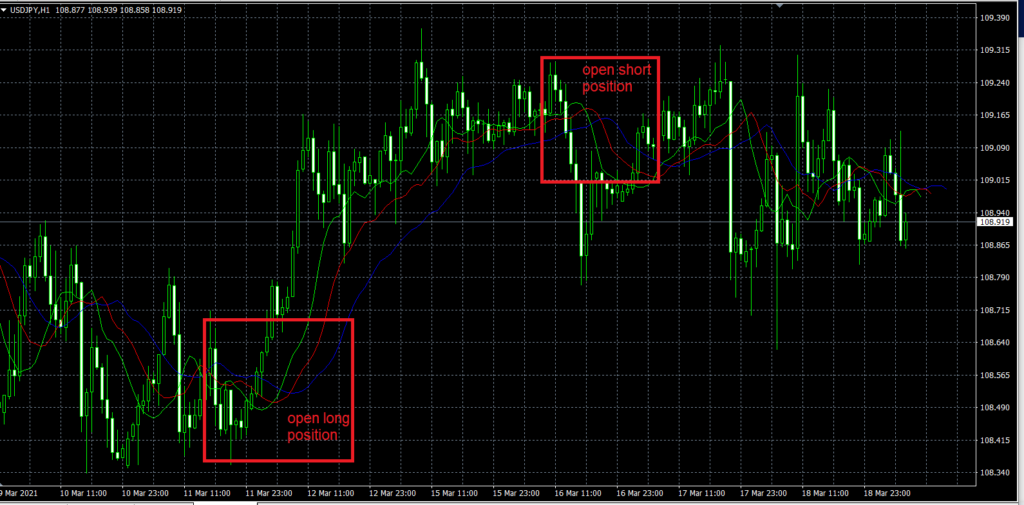
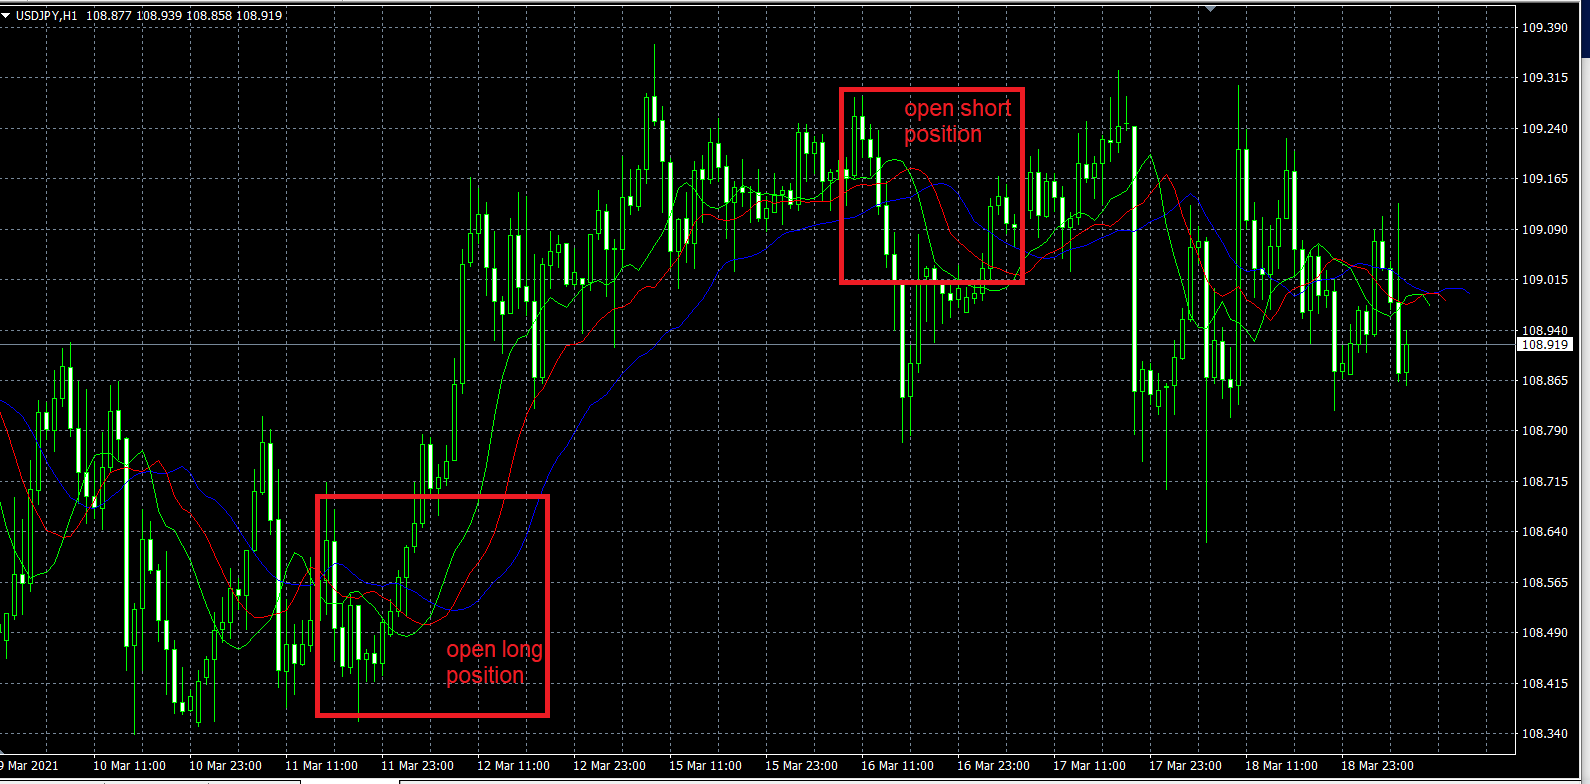
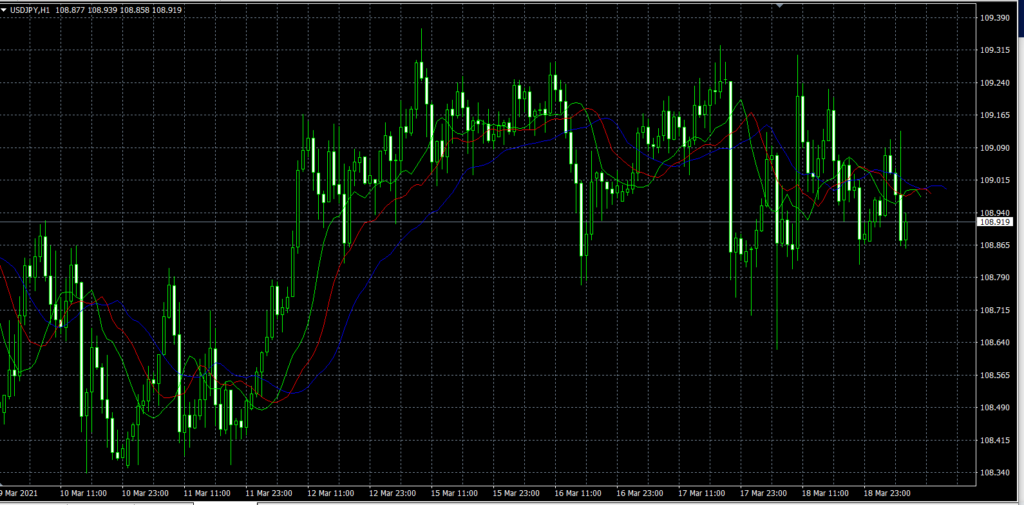
This would be the case in which this indicator is used alone. When the short-term moving averages (green and red) cross up the long-term line (blue) the trend is bullish. Therefore, we must enter a long position. For example: