Harmonic patterns are chart patterns found on price charts that combine the Fibonacci sequence to determine turning points. This method of trading, known as harmonic trading, tries to predict future movements. This is in contrast to most trading methods, usually reactive and non-predictive.
Geometry and Fibonacci
Harmonic patterns combine graphical and mathematical patterns giving an accurate trading method assuming that graphical patterns repeat with the same behavior. The mathematical basis of harmonic patterns is the primary ratio, that is, the Fibonacci number 0.618 or 1.618 (or derivatives). The so-called complementary ratios are: 0.382, 0.5, 1.41, 2.0, 2.24, 2.618, 3.14 and 3.618.
The primary ratio, according to the Fibonacci sequence theory, is found in most natural structures and events, but also in many man-made structures. This almost universal appearance also occurs in financial markets. This is what is assumed as the basis for the use of harmonic patterns.
Harmonic patterns as a trading method is attributed to Scott Carney, although there are many other authors who have described specific patterns and have contributed to the development of harmonic trading.
Things to consider before using harmonic patterns
Harmonic patterns are extremely accurate and require price to move by a certain magnitude so that a pivot point can be accurately determined. Harmonic patterns, beyond geometry, require that they match the Fibonacci sequence. On many occasions we can find patterns that at first glance seem harmonic but with proportions that do not fit with the Fibonacci sequence. These patterns whose proportions do not agree with the Fibonacci sequence are not valid from the point of view of harmonic patterns. Therefore, the trader willing to use harmonic patterns must be patient until a well-qualified pattern appears.
The objective of using harmonic patterns, as we said, is to find turning points but they can also predict the end of the movement currently present in the market. When the prediction is not fulfilled, it is very common for the movement against the prediction to be aggressive and fast, appearing another problem in the use of harmonic patterns. However, this problem has an easy solution by following one of the premises of trading: always control the risk associated with a trade and always use stoploss.
It should also be borne in mind that, like any other trading strategy or tool, it can be complemented by others. Thus, it is common for other graphic patterns to occur in the context of a harmonic pattern. In these cases, these other patterns can be used to help and support the prediction given by the harmonic pattern.
The harmonic pattern trading strategy can be used on any timeframe, given the fractal nature of the market, although it is important to focus on the chosen timeframe, which will be long timeframes, from 4 hours onwards to begin with.
Harmonic graphic patterns
There is a varied but not excessively extensive amount of harmonic patterns, although there are 4 of the best known, common and used: Gartley, Butterfly, Bat and Crab.
The inverted Gartley or Fibonacci pattern
The Gartley harmonic pattern was initially published by H.M. Gartley in his book “Profits in the Stock Market.” To this pattern the Fibonacci sequence was added by Scott Carney and published in the book “The Harmonic Trader”.
In the following image we can see a diagram of the bullish Gartley and bearish Gartley pattern:
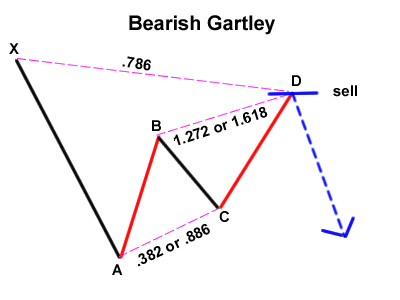
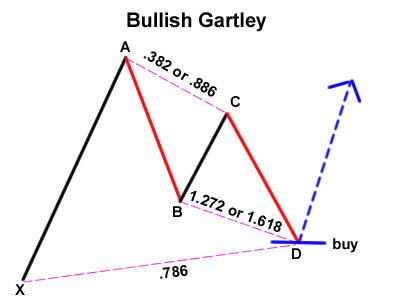
The bullish Gartley pattern appears most often at the start of uptrends and is indicative of a corrective move ending at point D, after which an upward move will follow. The zone at point D is known as PRZ, which stands for Potential Reversal Zone. In the PRZ the buy order will be placed with the stop placed just below this zone. The specific characteristics of this pattern are that point D is at the 0.786 Fibonacci retracement level of wave X-A and is situated between the 1.27 and 1.618 Fibonacci retracements of wave B-C. In a similar way, the bearish Gartley harmonic pattern is described.
The Butterfly pattern
The harmonic Butterfly pattern differs from the Gartley pattern in that the pivot point appears at a new low (bullish butterfly pattern) or at a new high (in the bearish butterfly pattern).
In the following image you can see an outline of the Butterfly pattern:
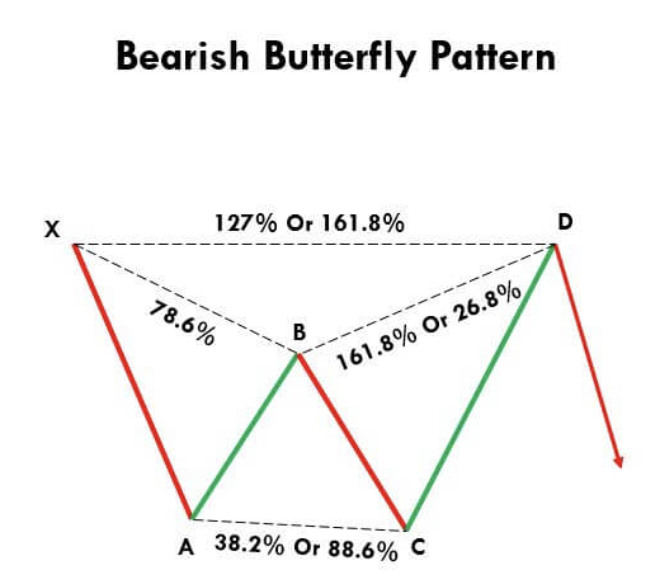
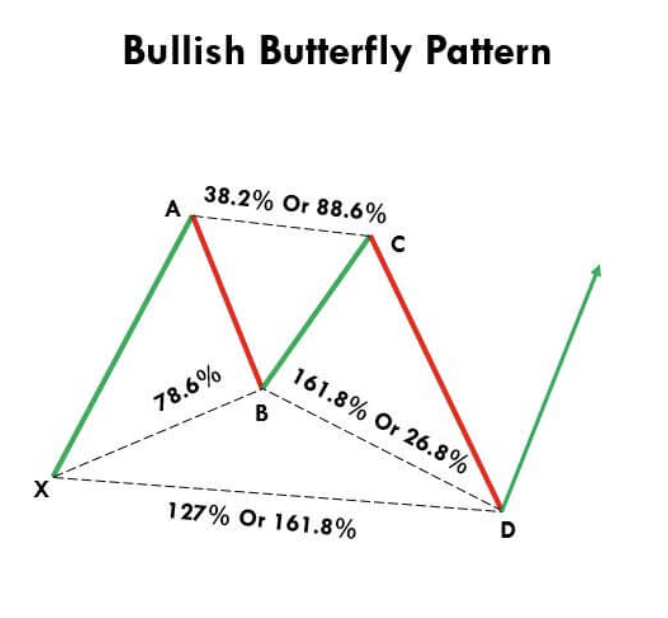
As can be seen from the image, point D on the bullish Butterfly pattern marks a new low signaling a potential turning point. This time, point D is between the 1.27 and 1.618 Fibonacci retracement of wave X-A and also between the 1.618 and 2.618 retracement of wave B-C. In a similar way, the bearish butterfly pattern can be explained.
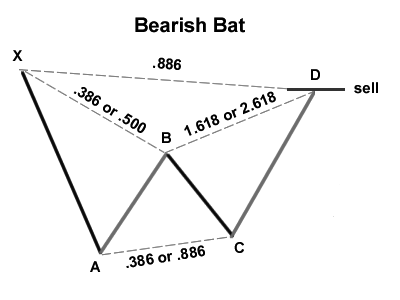
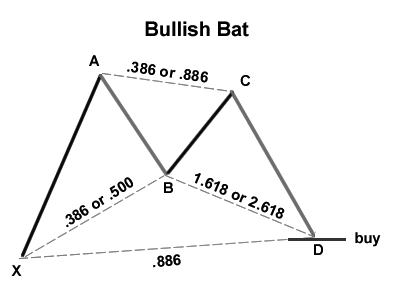
The harmonic Bat pattern
The bat pattern is very similar to the Gartley pattern, in fact visually it is almost the same, but the Fibonacci numbers are different. While in the Gartley pattern point B was located at the 0.618 retracement of the X-A wave, in the Bat pattern it is located between 0.382 and 0.5. Another important difference is that in the Gartley pattern point D is between 1.27 and 1.618 while in the Bat pattern point D is at least at the Fibo retracement of 1.618 and can reach the Fibo retracement 2.618 of wave B-C. Regarding wave X-A, point D represents the 0.886 retracement in the Bat pattern while the Gartley pattern was 0.786. The bearish Bat pattern is explained in a similar way.
The Harmonic Crab Pattern
The Crab pattern is considered by Scott Carney to be the most accurate of the harmonic patterns. It is a pattern similar to the Butterfly pattern but with different measures as far as the Fibonacci sequence is concerned.
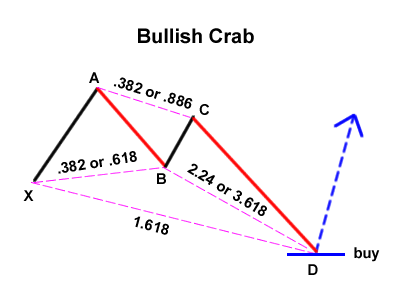
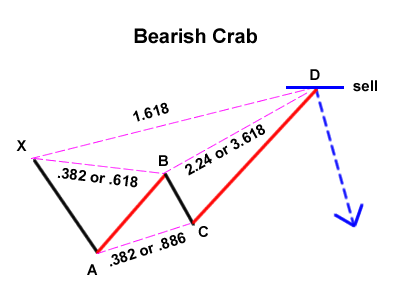
In the bullish Crab pattern, point D represents the 1.618 Fibonacci retracement of wave X-A and is located at a fairly wide ratio with respect to wave B-C, between 2.24 and 3.618.
Order entry and stoploss
Each harmonic pattern gives us a PRZ zone (in the zone around point D). As its name suggests, the PRZ is a zone and not an exact point. This zone is obtained from two measurements: the retracement with respect to wave X-A gives us a level and the retreat with respect to wave B-C gives us the other level that will determine the PRZ zone.
As you may have noticed, the PRZ zone can be wide because point D can be reached at different Fibonacci retracement levels than wave B-C. This can give us a small PRZ or, conversely, a wide PRZ. The PRZ tends to be wider as the timeframe increases. In case of having a narrow PRZ, we can enter any point of the PRZ, usually at the lower level of the PRZ zone in case of short entry or at the upper level of the PRZ in case of long entry. However, if we find a wide PRZ (more than 60 pips could be considered as a wide zone) it is better to wait to see the price reaction in this zone before executing the entry.
The stoploss should be set just outside the nearest Fibonacci level, just above (in case of selling) or below (in case of buying).
Conclusion
In summary, harmonic patterns are an accurate tool to build a trading method that is based on chart patterns and Fibonacci sequences. It requires a high dose of patience and deep study of the patterns that should include at least the 4 most important: Gartley, Butterfly, Bat and Crab.