The Average True Range (ATR) Indicator, devised by J. Welles Wilder Jr. in his groundbreaking book “New Concepts in Technical Trading Systems” in 1978, serves as a pivotal measure of market volatility. It’s worth noting that Wilder is the mastermind behind other renowned technical indicators such as the Relative Strength Index (RSI), Average Directional Index, and Parabolic SAR.
So, what sets the ATR apart? It represents the space between the maximum and minimum values of a bar within any given time frame. Wilder coined the term “true” range to account for gaps, acknowledging that market movements aren’t solely driven by regular ranges. Gaps can arise due to events like central bank statements or the release of US labor data, with smaller time frames often revealing more subtle gaps.
Understanding the range of a stock is crucial. It’s the difference between its daily high and low prices, providing insights into its volatility. Larger ranges signal higher volatility, while smaller ranges indicate lower volatility. Notably, the ATR is a versatile tool applicable to options, commodity futures, and stocks alike.
For example, consider the chart below depicting a five-day ATR following a price uptrend stall. As the ATR declines even after the price stabilizes, it acts as a warning sign of a lateral trading range, as indicated by the green horizontal lines. Falling ATR values suggest a market that is neither trending nor decisive. During a strong uptrend, the five-day ATR hovers around 80 points, dropping to 44 points after a bearish movement. It’s important to note a bearish jump after the highest value fall, emphasizing the need for the price to break the previous higher high and “close the gap” before assuming a resumption of the uptrend.
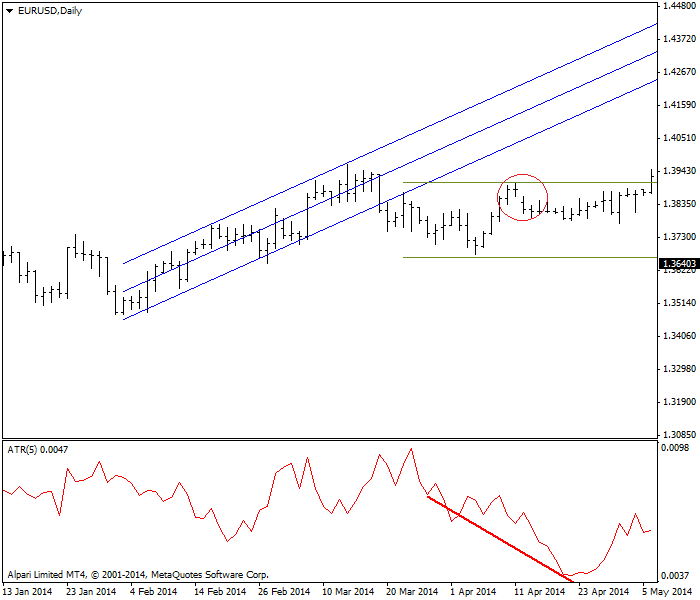
However, a word of caution: the ATR indicator doesn’t align with other trend lines, as seen in the chart above. The channel points upward while the ATR line moves sideways and choppy. Therefore, avoid using the ATR line to define the price trend. Instead, leverage it in conjunction with other indicators to confirm or refute directional conviction.
Wilder’s Average Directional Movement Indicator incorporates the ATR in its formula to factor in the concept of range, providing a direct estimate of market participation in a movement. A high ATR indicates a flurry of trades, while a low ATR signals subdued activity, often preceding a breakout.
Calculating the ATR involves determining the True Range, a metric developed by Wilder to address gaps and measure daily volatility more accurately. The True Range is the highest value among the results of three equations involving the day’s high, low, and previous day’s close.
In essence, the ATR isn’t typically used as a standalone indicator. Instead, it serves as a volatility measure, with small values indicating low activity and large values suggesting heightened activity. For a more comprehensive and visual measure of volatility, the Bollinger Bands, referred to as “the Squeeze” by Bollinger, offer a compelling alternative.