The Accumulation Distribution Indicator (ADL or AD) is a measure of volume. It was developed by the famous trader and analyst Marc Chaikin as a tool to choose the stocks to trade the most, but later the indicator became more widely used as a fundamental indicator for other markets, including Forex.
The accumulation / distribution indicator should not be confused with the Williams accumulation distribution indicator (WAD) which has the same name but is a totally different tool. The WAD indicator only considers price and therefore ignores the effect of volume.
We will focus on the Chaikin version, which is a volume accumulation distribution indicator.
The purpose of the accumulation distribution strategy is to identify discrepancies between prices and volume and to give an advance warning about future price movements. This article will discuss how the ADL indicator works and how to use it as a decision aid in trading.
But, first of all, what is meant by accumulation and distribution?
What is the Accumulation / Distribution Indicator
These two terms probably seem more technical and pretentious than they really are. If we think of an investor who “accumulates” shares, what does he do? Exactly, he just buys stocks. Similarly, an investor, who distributes shares in the market, sells.
Basically, the Accumulation Distribution Indicator is an attempt to measure supply and demand, the factors that logically determine the movement of prices.
Calculation of the Accumulation / Distribution Indicator
The distribution accumulation oscillator assesses the flow of money into and out of a financial instrument by examining both the trading range and the trading volume over a period of time.
The calculation of the AD indicator has three main steps.
The first step is to calculate the position of the closing price (close location value – CLV). The CLV compares the closing price for a given period with the price range for the same period and can have a value between -1 and +1.
- If the closing price is the lowest for this given period, the CLV is -1.
- If the closing value is the highest for the analyzed period, the CLV is +1.
- For any other value, the CLV oscillates between these two extremes.
The closing price position is calculated according to the following formula:
CLV = [(close – minimum) – (maximum – close)] / (maximum – minimum)
For the second step, multiply the CLV by volume to measure the flow of money during the period. A negative value represents a capital outflow and a positive value represents a capital inflow.
Monetary Flow = CLV * volume
The last step is to add the values obtained over various periods and this cumulative total gives us our accumulation / distribution index.
Then,
The current A / D value = previous A / D value + current value for (CLV x volume)
In summary, the distribution accumulation line consists of the total money flow into and out of the instrument we are examining.
But don’t worry if the idea of calculating all those values seems laborious! The great advantage of modern trading platforms is that they can display the results of an indicator instantly, no matter how complex the calculation is.
Even better, the Accumulation Distribution indicator is one of the standard MetaTrader 4 tools.
Interpreting The Indicator Accumulation/Distribution
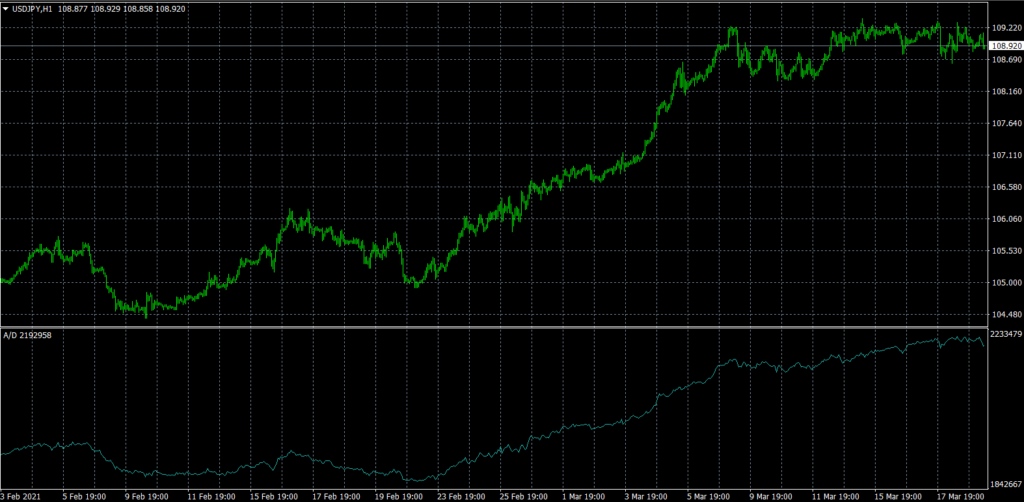
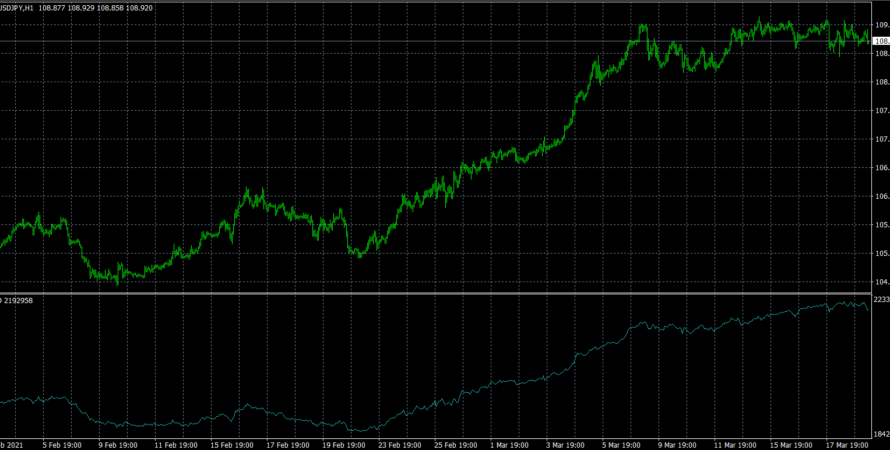
The image below shows a Forex distribution accumulation chart added below a USD / JPY hourly chart.

As mentioned above, the AD indicator gives us a representation of supply and demand. The direction of the line indicates whether it is the buying pressure or the selling pressure that dominates the market:
- If the A / D line goes up, there is a buying trend in the market
- If the A / D line goes down, it implies that the selling pressure controls the market
If there is agreement between the price and the ADL indicator, we have confirmation of the current trend!
As is the case with most indicators that attempt to measure the strength of price movements, the divergence between the price and our indicator is an important signal:
- If the price goes down while the A / D indicator goes up, we can wait for a price increase to come. That is to say a bullish reversal.
- If the price goes up while the A / D indicator goes down, it is a sign that the price may be about to fall. In other words, we can expect a bearish reversal.
Pay attention to the chart below of the USD / JPY pair, in particular the area between the two vertical dotted lines:
Forex Distribution Accumulation Indicator – Conclusion
We have already indicated in the introduction that this indicator has been developed for actions. The Forex Accumulation / Distribution indicator uses in its calculation the volume of ticks, for the volume coefficient.
Now the number of tick changes is a reliable approximation for the volume and it is not a problem.
A more significant drawback for the accumulation volume distribution indicator is probably the frequency with which the correlation between the indicator and price tends to be true. All of this means that you have to be patient to wait for infrequent periods of divergence between the price and the ADL indicator, which may indicate a change in the price trend.
Discipline is an important skill in trading and this indicator certainly requires skills in this area.
We hope this article has helped you answering the question what is the Accumulation Distribution indicator and how to trade with it.
Now you just have to practice with it on a demo trading account, with virtual funds, to operate in a risk-free environment but with real market conditions.


