Wondering how to learn Day Trading the stock market? One way is through technical analysis, let’s see how to do it!
As we have discussed, intraday trading represents more risk. There is a lot of movement in the forex markets or index CFDs over the course of a day, so the trends are shorter.
This is why an intraday trader must analyze his charts on different time frames. In order to understand in what technical context the currency or index you are trading is located. This is part of your trading plan.
Why?
Simply to know what happened in the previous days and to understand from a broader perspective where the market is and what trend we are in at the moment.
But for this you need to have a trading platform where you can perform your analysis. Download it by clicking on the following image!
Technical analysis on daily chart
Open your daily chart (D1) and answer the following questions:
- Is the currency pair you want to trade in consolidation?
- What is the underlying trend?
- Is the Forex trend bullish or bearish?
Keep in mind that the trend indicated by the highest time frame is the most relevant, the one with the most force.
Let’s look at an example to learn how to day trade!

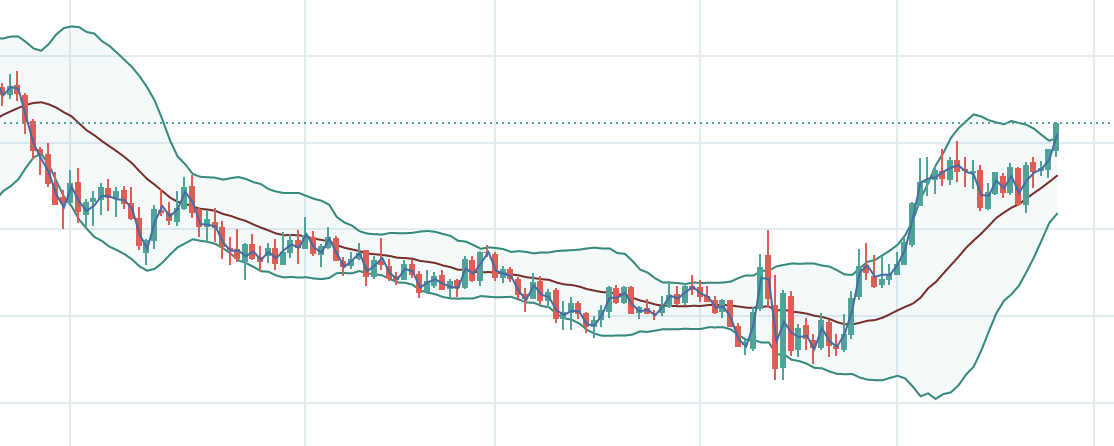
Analyzing the EURUSD currency pair on a daily chart we can see that the price is in a bearish channel.
Next, you need to go to a shorter-term chart to more accurately locate key support and resistance levels.
Hourly chart technical analysis
This type of chart (H1) will help you identify the supports and resistances that will play an important role during the day trading session. Also to identify buy and sell signals:
- A bullish scenario above the resistances.
- A bearish stage under the supports.
Following the same example above:

The story changes radically once we consult the hourly chart. Within the descending channel, the price is in another ascending channel, with new support and resistance.
But let’s get closer to the graph!
M5 chart technical analysis
Identify the trading signals and trade on a 5M chart, based on the information collected in the previous time frames.