In the dynamic world of trading, success often depends on the ability to recognize and interpret various chart patterns. While no strategy guarantees success every time, understanding key trading patterns can significantly enhance your decision-making process. Here, we will explore some fundamental patterns that every trader should know to potentially increase their chances of making profitable trades.
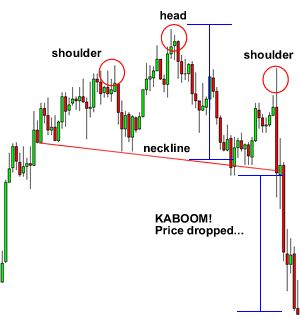
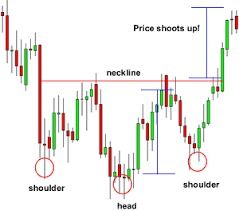
1. Head and Shoulders
The Head and Shoulders pattern is one of the most reliable trend reversal patterns. It typically forms after an uptrend and signals that the current trend is about to end. The pattern consists of three peaks: the left shoulder, the head, and the right shoulder. The head is the highest peak, and the shoulders are of roughly equal height. The key to this pattern is the ‘neckline,’ which is formed by drawing a line connecting the low points of the two troughs. A breakout below the neckline confirms the pattern, suggesting a potential sell.
 |  |
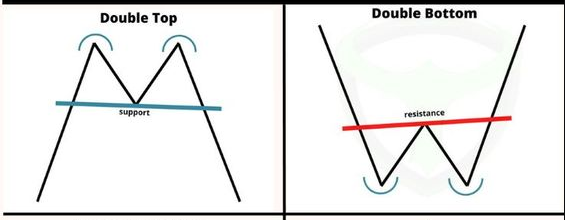
2. Double Top and Double Bottom
These are reversal patterns that signal a shift in market sentiment. A Double Top appears after an uptrend and looks like two consecutive peaks with a slight trough in-between. It indicates that the price is struggling to push higher, and a reversal is likely. Conversely, a Double Bottom forms after a downtrend and features two consecutive troughs with a peak in between, signaling a potential upward reversal. Traders typically enter or exit trades based on a break through these formations’ confirmation levels.
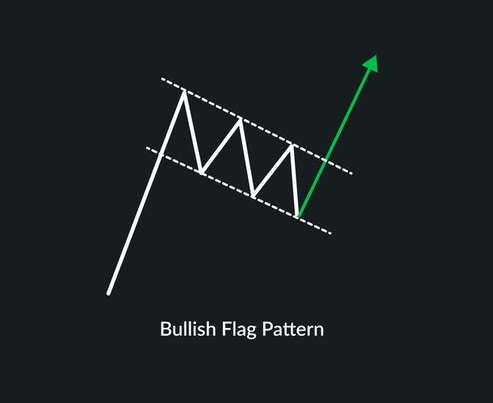
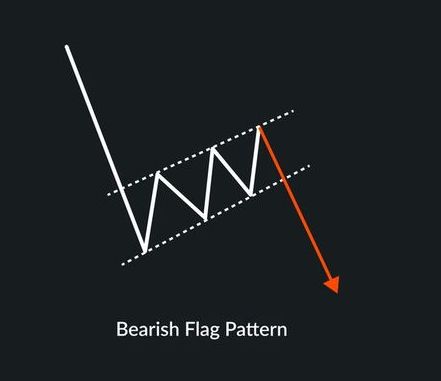
3. Bullish and Bearish Flags
Flags are continuation patterns that indicate a brief consolidation before the market resumes its prior trend. A Bullish Flag forms during an uptrend when the price consolidates downwards briefly, forming a rectangular shape. The Bearish Flag is the inverse, occurring in a downtrend with the price consolidating upwards. These patterns are confirmed when the price breaks out of the consolidation in the direction of the preceding trend, suggesting an opportunity to join the trend.
 |  |
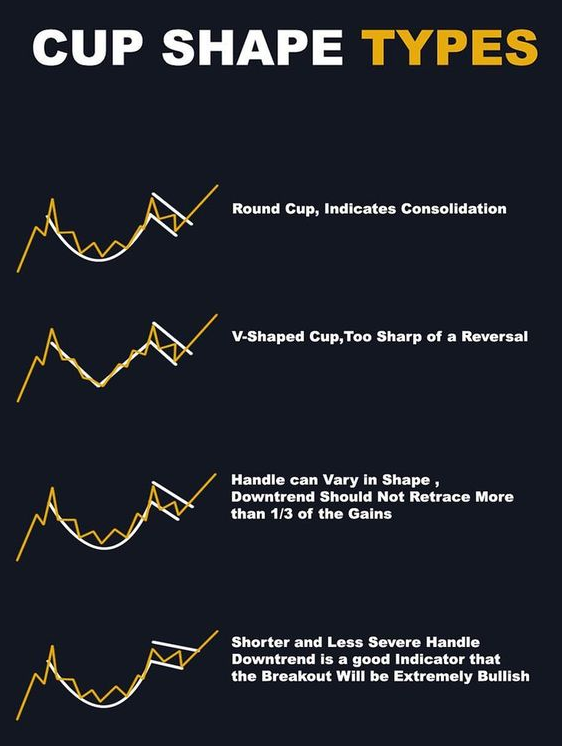
4. Cup and Handle
The Cup and Handle is a bullish continuation pattern that resembles a teacup on a chart. The “cup” is a U-shaped recovery after a significant decline, followed by a slight “handle” where the price consolidates or slightly dips. The completion of the handle with an upward price breakout is seen as an ideal time to buy, as it often precedes a rise in price.
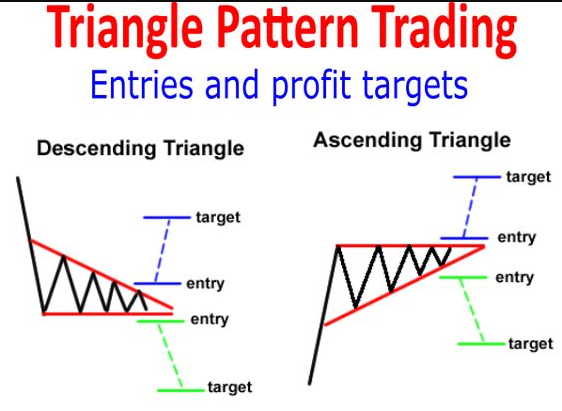
5. Triangles (Symmetrical, Ascending, and Descending)
Triangles are common in the trading world and can signify continuation or reversal depending on their type and the prevailing market trend. A Symmetrical Triangle is formed when the price converges with lower highs and higher lows, indicating uncertainty. Ascending Triangles have a flat upper side and rising lower trendline, suggesting bullish sentiment. Descending Triangles have a flat lower side with a declining upper trendline, indicating bearish sentiment. The breakout direction often dictates the trade: upwards for bullish setups and downwards for bearish setups.
Conclusion on trading patterns
While these patterns provide valuable insights, traders should remember that no pattern works all the time. Market conditions can change unexpectedly due to various external factors. Therefore, it’s essential to use these patterns in conjunction with other technical analysis tools and sound risk management strategies. By doing so, traders can improve their odds of success and potentially reduce losses. Remember, the key to successful trading lies not just in recognizing patterns, but in disciplined execution and continuous learning.
